An LED lens sample may look transparent, fit the PCB and produce an attractive spot on a wall, but these observations do not prove that it is ready for mass production. Reliable approval requires controlled LED lens testing that verifies mechanical fit, luminous intensity distribution, beam characteristics, optical efficiency, uniformity and production consistency.
The result must also represent the customer’s actual lighting system. Changing the LED package, PCB position, driving current, lens height, holder or protective cover can change the measured distribution, even when the same lens is used.
Asahi Optics develops and manufactures LED lenses for outdoor, indoor, industrial, automotive, medical and specialty lighting. This guide explains how luminaire manufacturers can evaluate LED lens optical performance before approving a sample, mold or production batch.
Why Visual Inspection Alone Is Not Enough
Visual inspection is an essential first step, but it only identifies visible surface and molding conditions. It cannot determine whether a lens directs the correct luminous intensity toward every required angle.
A lens may appear acceptable while still producing:
- An incorrect beam angle
- A shifted central hotspot
- Insufficient intensity in important directions
- Excessive spill light outside the target area
- Uneven horizontal and vertical distributions
- Secondary peaks, rings or dark zones
- Color separation near the edge of the beam
- Different results between mold cavities
A wall projection is also affected by test distance, wall color, ambient light and camera exposure. Automatic camera settings can make a low-output beam look as bright as a high-output beam because the camera adjusts exposure independently.
Wall images remain useful for comparing beam appearance under controlled conditions. They should be treated as supporting evidence rather than a replacement for measured photometric data.
Build a Repeatable LED Lens Test Assembly
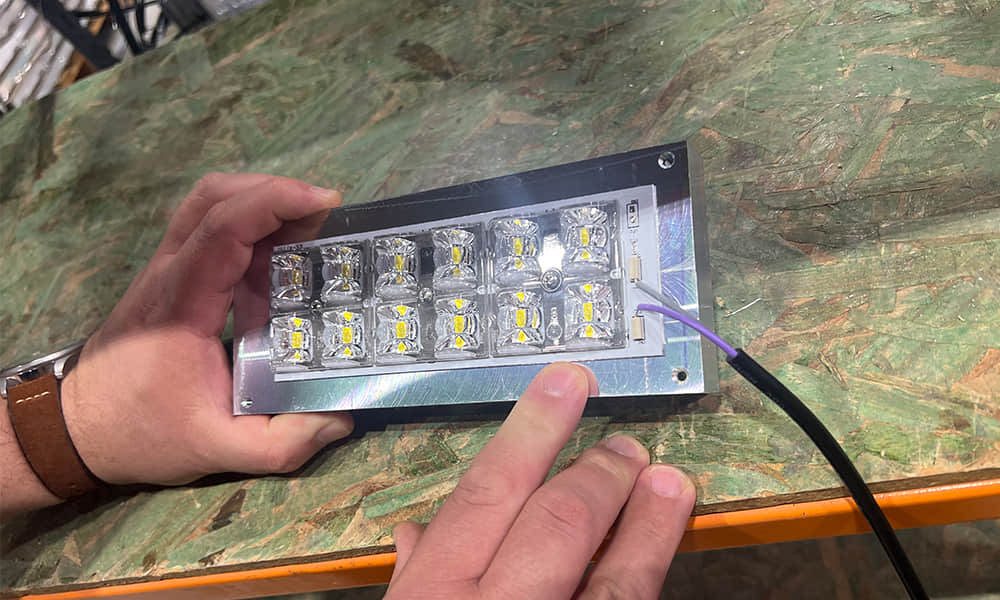
Before testing the sample, create an assembly that reproduces the intended luminaire as closely as practical. The objective is to ensure that every sample is measured under the same optical, electrical, mechanical and thermal conditions.
Use the Exact LED Model
LEDs with the same general package label can have different light-emitting areas, die layouts, phosphor shapes and dome geometries. Two 5050 LEDs, for example, may not produce the same distribution through one lens.
Record the following source information:
- LED manufacturer and complete part number
- Package dimensions and package height
- Dimensions of the light-emitting surface
- Optical center and source orientation
- Nominal luminous flux
- Color temperature or wavelength
- Operating current and voltage
- Expected board or junction temperature
If the lens was designed or originally tested with a different LED, the old photometric data should be treated as a reference rather than proof of the new combination’s performance.
Control the LED-to-Lens Position
The position of the LED relative to the optical cell is one of the most important test variables. Lateral displacement, vertical error and angular tilt can move the hotspot, change the beam width or create an asymmetric distribution.
Use locating pins, reference surfaces or a repeatable holder instead of placing the lens over the LED by hand. The test fixture should control:
- Horizontal and vertical LED coordinates
- LED emitting-surface height
- Lens-to-PCB distance
- Lens rotation
- Compression from screws, clips or gaskets
- Position of any reflector, diffuser or protective cover
For multi-LED arrays, compare the center of every optical cell with the corresponding LED coordinate. The overall lens dimensions can match the PCB while individual cells remain misaligned. See Asahi’s guide to matching an LED lens to a PCB layout for a complete mechanical compatibility check.
Stabilize the Electrical and Thermal Conditions
LED output changes with current and temperature. A cold luminaire measured immediately after power-on may produce a different luminous flux and color from the same luminaire after thermal stabilization.
For comparative testing:
- Use the same driver and operating current
- Use a representative heat sink
- Record ambient and board temperature
- Apply the same stabilization time
- Measure the same electrical input parameters
- Keep the test orientation consistent
Without these controls, an apparent difference between two lenses may actually be caused by LED temperature or electrical variation.
Step 1: Inspect the Lens and Assembly Fit
Begin the LED lens quality inspection before powering the assembly. Use diffuse light, directional light and magnification where appropriate.
Inspect Optical and Cosmetic Surfaces
Check the lens for:
- Scratches and abrasion
- Black spots or contamination
- Bubbles, voids or silver streaks
- Flow lines and weld lines
- Flash or burrs
- Gate damage
- Sink marks
- Cloudiness or discoloration
- Incomplete filling of optical features
Not every visible line has the same significance. A shallow handling scratch, material flow line and structural crack require different investigations. Record the feature’s location, depth and mold cavity before deciding whether it affects optical or mechanical performance.
Check Dimensions and Flatness
Measure the dimensions that control assembly and optical position, including locating pins, support feet, screw holes, overall flatness and the height between the mounting datum and optical cell.
Do not evaluate only the overall length and width. A small height error near the LED can change the focal relationship, while a warped mounting surface can tilt different optical cells in different directions.
Perform a Stress-Free Fit Check
Place the lens into the housing without forcing it into position. Confirm that:
- The lens rests on the intended datums
- Locating pins enter without interference
- Electronic components do not contact the optic
- The lens does not rock or spring upward
- Screws and clips do not visibly distort the part
- The gasket compresses according to the assembly design
If the lens must be bent or pulled into place, the resulting stress may change its position and increase the risk of cracking during thermal or environmental testing.
Step 2: Measure the Luminous Intensity Distribution
The most direct way to evaluate a beam-forming lens is to measure luminous intensity over the relevant directions. A goniophotometer rotates the luminaire or detector relationship and records candela values at defined angles.
This measurement can produce:
- Polar candela curves
- Isocandela diagrams
- Three-dimensional intensity distributions
- Intensity values in principal photometric planes
- Photometric files for application simulation
Compare the Correct Photometric Planes
A symmetric spotlight may have similar distributions in its main planes. An asymmetric street, aisle, wall-wash or automotive optic can intentionally produce substantially different curves.
Compare:
- The direction of maximum intensity
- Peak candela
- Horizontal and vertical spread
- Distribution symmetry or intended asymmetry
- Intensity at critical angles
- High-angle spill light
- Secondary peaks outside the main beam
Maximum candela should not be evaluated alone. A lens can produce a high central value while failing to cover the required target area.
Use a Consistent Coordinate System and Orientation
Record how the luminaire is oriented during testing. An asymmetric distribution may appear incorrect if the lens or photometric file is rotated relative to the intended application.
Use consistent reference axes for the PCB, lens, housing and photometric equipment. Marking the optical orientation on prototype components can prevent left-right or longitudinal-transverse confusion.
Step 3: Verify Beam Angle and Field Angle
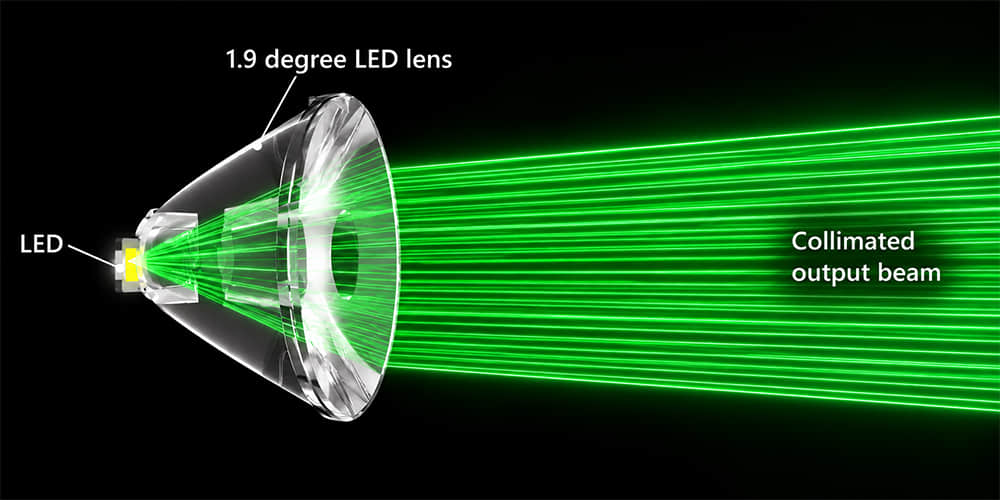
Beam angle is commonly defined using the directions where intensity falls to 50% of the maximum. Field angle usually extends to the 10% intensity points. These values describe different regions of the distribution.
A 30-degree beam angle does not mean that all visible light stops at 30 degrees. Lower-intensity light can extend much farther, which is why two nominally identical lenses may create different apparent pools of light.
When verifying a sample, record:
- Beam angle in each relevant photometric plane
- Field angle in each relevant plane
- Center beam candlepower
- Hotspot location
- Transition smoothness
- Intensity outside the main field
For a more detailed explanation of the two boundaries, see Beam Angle vs Field Angle: Why 30° Lenses Look Different.
For asymmetric or freeform optics, a single angle may not adequately describe performance. Use the complete intensity distribution and application-level simulation for final approval.
Step 4: Check Optical Efficiency
LED lens optical efficiency describes how much source light remains available after interacting with the optic, but the calculation method must be clearly defined.
An integrating sphere can measure total luminous flux under controlled conditions. A comparative test may measure the same LED assembly with and without the lens, provided that electrical input, thermal state, fixture geometry and measurement configuration remain consistent.
A simplified comparison may use:
Optical efficiency = luminous flux with the optical component ÷ reference luminous flux under the defined test condition
The result must state what is included in the reference and tested configurations. A lens, holder, reflector, protective cover and complete luminaire will produce different loss values.
Total Flux Is Not the Same as Useful Light
A lens may reduce total lumens slightly while greatly improving the amount of light reaching the target area. Another optic may retain a high proportion of total flux but send much of it outside the useful zone.
Evaluate both:
- Total optical transmission or lumen retention
- Intensity delivered to the required directions
- Spill light outside the target
- Application illuminance or luminance
For this reason, the optic with the highest total lumen result is not automatically the best choice for the lighting project.
Step 5: Evaluate Uniformity and Beam Artifacts
A distribution can meet its nominal beam angle while still showing poor visual quality. Evaluate the complete pattern for smoothness and unwanted artifacts.
Common Beam Artifacts
- Dark center inside the main beam
- Multiple hotspots
- Bright rings around the central spot
- Sharp unintended lines
- Uneven left and right intensity
- Color bands near the beam edge
- Images of individual LED dies
- Stray light caused by the holder or housing
These features may originate from the lens, but they can also be caused by LED structure, misalignment, protective glass, internal reflections or mechanical obstruction.
Measure Uniformity on a Defined Plane
If the application requires a uniform illuminated area, define the test distance, plane size, measurement grid and calculation method before comparing samples.
Depending on the application, uniformity may be evaluated using illuminance values, luminance images or project-specific intensity zones. Do not compare ratios calculated using different definitions, such as minimum-to-average and minimum-to-maximum.
A controlled camera image can supplement the numerical results. Fix the exposure, aperture, white balance, distance and screen or target surface for every sample.
Step 6: Check Color and Spectral Changes
Transparent optics do not always leave the visible beam color completely unchanged. Material transmission, LED angle-dependent color, total internal reflection and surface geometry can contribute to color variation across the beam.
Measure or inspect:
- Chromaticity coordinates
- Correlated color temperature where applicable
- Color variation from the beam center to the edge
- Yellow, blue or green rings
- Differences between optical cells
- Changes after thermal stabilization
Multi-die and large light-emitting-area LEDs can be more difficult to mix into a clean narrow beam. If a color artifact changes when the LED is rotated or replaced, investigate the source structure and LED-to-lens alignment before modifying the mold.
Step 7: Test Assembly and Thermal Stability
A sample that performs correctly in a loose laboratory fixture may change after it is installed in the production housing. Fasteners, gaskets, heat and neighboring components can alter the lens position or shape.
Compare Cold and Stabilized Measurements
Record photometric results after a defined warm-up period and compare them with the cold condition. Changes may result from:
- LED thermal droop
- LED color shift
- Driver behavior
- PCB or housing expansion
- Lens movement or deformation
- Changes in mechanical preload
Do not assign all output reduction to the optical material. Electrical power and LED temperature must be recorded before the lens is identified as the cause.
Repeat the Test After Assembly Cycling
Where appropriate, remove and reinstall the lens using the documented assembly process. Compare repeated measurements to determine whether screw torque, clip position or gasket compression changes the distribution.
For outdoor, industrial or automotive products, the wider validation plan may also include temperature cycling, vibration, humidity, UV exposure or chemical compatibility. The exact program should follow the product’s intended environment and applicable requirements.
How to Compare Simulation, Datasheet and Physical Results
Simulation, supplier data and sample measurements serve different purposes. They should support one another rather than be treated as interchangeable proof.
| Data source | What it can show | Main limitation |
|---|---|---|
| Optical simulation | Design feasibility, ray paths and predicted intensity distribution | Accuracy depends on the LED model, materials, geometry and assumptions |
| Supplier datasheet | Reference performance for a stated lens and source configuration | The customer’s LED, PCB or housing may be different |
| IES or LDT file | Numerical intensity distribution for a defined configuration | The file only represents the configuration used to create it |
| Physical prototype | Actual behavior of the project assembly | The result is reliable only when test conditions are controlled |
| Production sampling | Repeatability across cavities, batches and process conditions | Requires traceability and a defined sampling plan |
When using photometric data, confirm the LED, PCB, current, lens, holder and luminaire orientation represented by the file. Asahi’s guide to reading an IES file for LED lens selection explains how to check the configuration and main distribution diagrams.
Use Standardized Photometric Methods Appropriately
Standardized test methods improve repeatability and make results easier to compare. However, the scope of the method must match the item being tested.
ANSI/IES LM-79 addresses optical and electrical measurements of solid-state lighting products. It is primarily relevant to complete SSL products rather than claiming universal performance for an isolated plastic lens.
The U.S. Department of Energy also lists LM-79 among the recognized solid-state lighting metrics and test methods. For a customer’s internal lens comparison, a controlled engineering test can be useful, but reports should clearly identify whether the measured item was the lens assembly, optical module or complete luminaire.
Do not label an isolated component test as an LM-79 luminaire report unless the tested product and laboratory procedure meet the applicable scope and requirements.
Create Practical LED Lens Acceptance Criteria
Before receiving T0 or T1 samples, define which results will determine approval. Without agreed criteria, different teams may judge the same sample according to appearance, dimensions or a single photometric value.
| Acceptance item | Possible evaluation method | Project decision |
|---|---|---|
| Mechanical fit | Drawing inspection and representative assembly | Define critical datums and interference limits |
| Surface quality | Visual inspection under defined lighting and magnification | Define acceptable and rejectable zones |
| Peak intensity | Goniophotometer measurement | Set target and permitted variation |
| Critical-angle intensity | Candela distribution at specified directions | Define minimum or maximum values as required |
| Beam and field angles | 50% and 10% intensity boundaries | Define planes and tolerance |
| Hotspot position | Photometric distribution or controlled beam image | Define permitted horizontal and vertical displacement |
| Optical efficiency | Integrating-sphere or defined comparative measurement | Document the reference configuration |
| Uniformity | Illuminance grid or luminance image | Define calculation method and target plane |
| Color performance | Spectroradiometric or project-specific color measurement | Define center, edge and cavity-to-cavity limits |
| Production consistency | Samples identified by cavity, batch and molding condition | Define sampling frequency and variation limits |
The correct limits depend on the luminaire and application. A narrow stadium optic, asymmetric street lens, diffused linear optic and automotive signal lens should not share one universal acceptance tolerance.
Compare Samples by Mold Cavity and Production Batch
One acceptable sample does not prove that the production process is stable. Multi-cavity molds should be evaluated with samples identified by cavity. Trial samples should also retain information about molding date, resin batch and process condition.
A practical comparison may include:
- Several parts from every mold cavity
- Samples from different points in the trial run
- Repeated assembly and photometric measurements
- Part weight and critical dimensions
- Visual surface condition
- Key intensity and angle values
If one cavity consistently produces a shifted beam or different optical efficiency, investigate the cavity surface, lens dimensions, gate condition and local molding process before averaging all results together.
Asahi’s mold assembly, trial and optical testing process describes how trial samples can be traced, inspected and compared before production parameters are released.
Common LED Lens Testing Mistakes
Comparing Samples With Different LEDs
Different LED models or bins can change output, source size and color. Use the same controlled source or document the difference before attributing the result to the lens.
Holding the Lens by Hand
Hand positioning cannot maintain a repeatable optical center, height or tilt. Use a fixture or representative housing.
Changing More Than One Variable
Replacing the LED, PCB, lens and holder at the same time makes the cause of any improvement or failure unclear. Compare controlled configurations and change one major factor at a time.
Using Automatic Camera Exposure
Automatic exposure hides absolute brightness differences and can change the apparent beam width. Lock the camera settings for visual comparisons.
Testing Only One Sample
A single sample cannot show cavity or process variation. Use an appropriate sample plan for the project stage.
Ignoring Thermal Stabilization
Cold and stabilized LED output can differ. Use consistent warm-up and temperature conditions.
Using an Old IES File After Changing the PCB
Changing the LED package, position or optical height can change the distribution. New photometric testing may be required.
Approving Only the Nominal Beam Angle
A correct beam angle does not confirm center intensity, field angle, spill light, uniformity or asymmetric performance.
What to Send Asahi for an Existing Lens Recommendation
To evaluate whether an available optical component can meet the project, provide:
- LED manufacturer and exact model
- LED datasheet and emitting-surface information
- PCB drawing with LED coordinates
- Luminaire or module 2D and 3D files
- Available optical and mounting space
- Operating current and power
- Target beam angle and field angle
- Required intensity distribution or reference IES file
- Application and installation conditions
- Existing sample photos and photometric results
- Specific acceptance criteria
This information helps determine whether an existing lens can be tested directly, whether the PCB or holder should be adjusted or whether a dedicated optical design is necessary.
Approve the Lens Based on Measured Project Performance
LED lens sample testing should connect mechanical inspection, controlled optical measurement, assembly verification and production consistency. A clear lens and an attractive wall spot are useful observations, but they are not enough to approve a component for mass production.
Use the intended LED, PCB and housing. Control current, temperature, optical position and test orientation. Compare the complete luminous intensity distribution, not only beam angle or maximum candela. Define acceptance limits before testing and trace samples by mold cavity and batch.
If you need an existing lens recommendation or support evaluating an optical sample, contact Asahi Optics with your LED model, PCB layout, available space, target distribution and current test results. Our team can review the configuration and recommend the most practical validation or development route.