LED lights can become dimmer over time, but there is no universal brightness-loss percentage after three years. For luminaire manufacturers, lighting engineers, and maintenance teams, the useful assessment starts with operating hours, applicable maintenance data, and comparable measurements—not calendar age alone.
This guide explains how to interpret the available evidence, distinguish recoverable output changes from permanent deterioration, and decide whether an installation needs maintenance, investigation, or replacement.

Convert Three Years into Operating Hours
Calculate accumulated runtime before comparing the installation with a lumen-maintenance report.
Operating hours = average daily operating hours × operating days
| Daily Operation | Annual Operating Hours | Three-Year Operating Hours |
|---|---|---|
| 4 hours | 1,460 | 4,380 |
| 8 hours | 2,920 | 8,760 |
| 12 hours | 4,380 | 13,140 |
| 24 hours | 8,760 | 26,280 |
Continuous operation accumulates six times the hours of four-hour daily operation. It does not imply six times the depreciation: temperature, drive conditions, and the shape of the maintenance curve also affect the result. Use recorded runtime where available.
Use Lumen-Maintenance Data, Not an L70 Shortcut
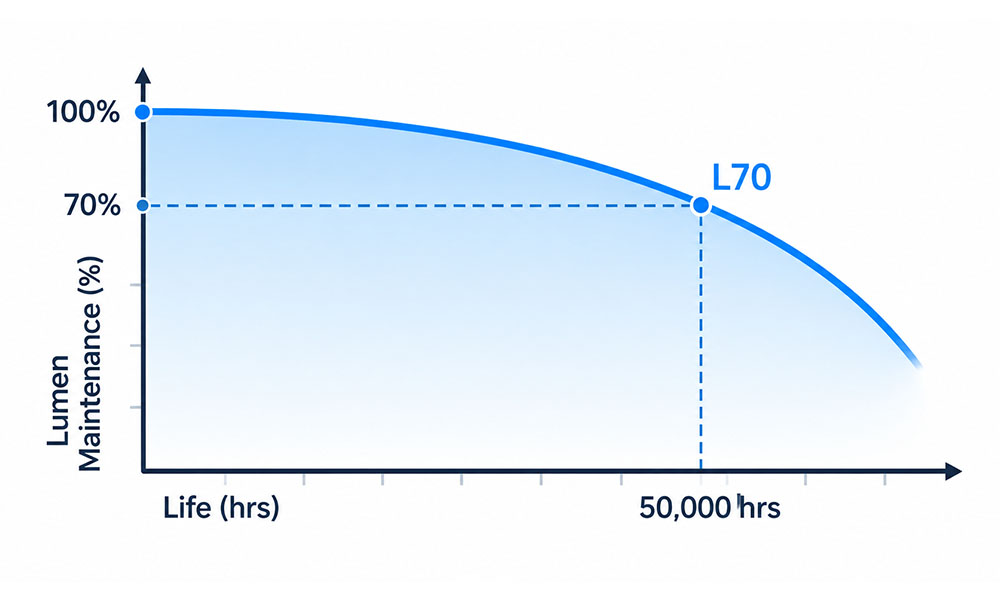
L70 describes a threshold of 70% of initial luminous flux. Its associated time identifies when that threshold is measured or projected to be reached under specified conditions. It is not a switch-off time or a complete history of light output.
You cannot divide the loss associated with L70 evenly across its rated hours to calculate three-year depreciation. A maintenance curve need not decline at a constant rate.
LM-80 provides maintenance-test data for LED packages, arrays, and modules; TM-21 provides a projection method using applicable data. Neither an LED component report nor its projected L70 time, by itself, establishes complete-luminaire lifetime. Drivers and optical components introduce additional degradation and failure mechanisms.
A Published Example: What Comes After 8,760 Hours?
For eight-hour daily operation, the three-year reference is 8,760 hours. A public Bridgelux LED-package LM-80 report, R2XM190402062-10, contains this measured dataset:
- Tested model: BXEN-27E-11M-39A, nominal 2700 K.
- Maintenance conditions: nominal 85°C case-temperature group, 120 mA DC, 25 samples.
- Photometric measurement conditions: 120 mA, ambient temperature 25°C ± 2°C.
- Average lumen maintenance: 98.45% at 8,000 hours and 98.24% at 9,000 hours.
The 9,000-hour value represents a 1.76% reduction in the group’s average normalized output. It is a measured LED-component result—not a TM-21 prediction, an Asahi test, or a complete-luminaire result.
The report does not contain an 8,760-hour measurement. Do not relabel its 9,000-hour value as an exact three-year loss. An estimate at the intervening time requires a stated interpolation or modelling method and must be identified as estimated. First verify that the installed LED and operating conditions are applicable; these figures are not a general prediction for other products.
Separate Recoverable Dimming from Persistent Deterioration
A lower field reading does not immediately identify LED ageing. Check the following three situations in order.
1. Illumination Improves After Cleaning
Dust and oily deposits can reduce transmission or scatter light at exposed surfaces. Record the as-found reading, clean using the manufacturer’s approved procedure, and repeat the measurement after stabilization.
Recovery identifies contamination as a contributor. Any remaining difference still needs investigation; cleaning does not establish that all components are unchanged.
2. Output Recovers When Operating Conditions Are Restored
Check dimming commands, occupancy controls, schedules, and thermal-protection behaviour. Reduced output may reflect a control state rather than permanent depreciation.
Temporary thermal output reduction is different from permanent ageing. A luminaire may produce less light while hotter and recover at its original reference conditions. Long-term thermal damage, however, does not disappear when the product cools.
Compare stabilized operation at the reference ambient temperature and settings—not a cold-start reading against a fully warmed-up reading.
3. Output Remains Lower Under Comparable Conditions
Persistent reduction can involve LED deterioration, failed emitters, altered driver output, or changes in the optical assembly. The spatial pattern offers useful clues: a shifted beam or a newly dark region warrants a different investigation from a broadly reduced distribution.
For outdoor luminaires, review the LED, mounting interface, and required distribution when evaluating replacement optics. Asahi’s street and area lighting lens range provides product formats for this selection process, but a different lens should not be treated as a remedy for an unresolved driver or thermal problem.
Service safety: isolate power and allow cooling before approved cleaning or inspection. Internal electrical checks and opening sealed assemblies require qualified personnel and manufacturer procedures. Never bypass thermal protection or increase current to compensate for unexplained dimming.
Measure the Change Without Overstating the Result
Start with a Documented Baseline
An installation or commissioning measurement provides the most useful reference. Without it, the actual three-year depreciation rate cannot be calculated directly.
A catalogue lumen value cannot replace a site lux baseline. A new fixture can provide a comparison, but production variation means it is not an exact reconstruction of the aged fixture’s original output.
Keep the Comparison Repeatable
- Instrument: use a suitable calibrated lux meter, preferably the same instrument, and consider measurement uncertainty.
- Geometry: reproduce sensor position, height, orientation, measurement plane, and luminaire aiming.
- Operating state: match control settings and relevant supply conditions; allow readings to stabilize and record ambient temperature.
- Environment: control daylight, neighbouring lighting, and changes in obstructions or surrounding surfaces.
- Cleanliness: distinguish as-found and cleaned measurements rather than silently mixing them.
- Sampling: repeat a fixed grid across the working area and compare its individual readings, average, and minimum.
A grid matters because a single centre reading can miss reduced illumination at the edges or a change in distribution.
Distinguish Illuminance Loss from Lumen Depreciation
For a fixed measurement point:
Illuminance reduction (%) = [(initial lux − current lux) ÷ initial lux] × 100
A comparable change from 1,000 lux to 900 lux demonstrates a 10% reduction at that point. It does not independently demonstrate a 10% reduction in total luminaire lumens. Measuring total luminous flux requires appropriate photometric equipment and procedures.
If an investigation moves from installation measurements to component approval, our guide to LED lens optical performance testing explains the controlled checks used to evaluate distribution and optical performance.
Maintain, Investigate, or Replace?
Use the installation’s required performance and condition to make the decision:
- Maintain and monitor when cleaning or correcting controls restores the required illumination.
- Investigate or repair when flicker, failed emitters, unexpected colour changes, or persistent output loss indicate a component problem.
- Replace or redesign when lighting requirements are no longer met and an approved repair is unavailable or unsuitable.
Three years alone is not a replacement trigger. Equally, a luminaire that still lights up is not necessarily meeting its task-lighting requirements. Signs of overheating, damaged wiring, or water affecting electrical parts require prompt safety assessment rather than continued comparison testing.
What an Optical Review Can Clarify
When the investigation points toward the lens or its interface, start with the LED model, lens identification or drawing, operating environment, and photographs. Add runtime and comparable photometric results if available.
Asahi’s preliminary optical review can help identify:
- Compatibility concerns: whether the source size, LED position, mounting arrangement, or optical envelope presents a matching issue.
- Missing verification: which dimensional checks or controlled optical comparisons are needed before choosing a replacement.
- Candidate alternatives: whether existing lens options merit evaluation against the required distribution and assembly.
The review supports an optical selection decision; it does not replace electrical diagnosis or establish the remaining lifetime of an installed luminaire.