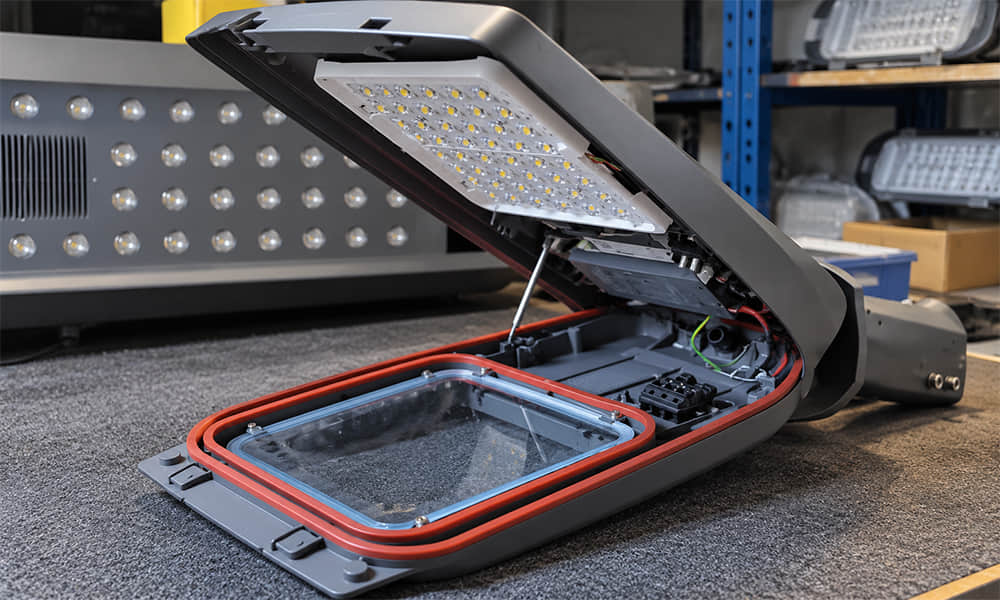
Selecting an LED street light lens requires more than checking its size, beam angle or LED compatibility. A lens may be described as Type II, Type III, asymmetric or cutoff, but these terms alone do not show exactly where the light will travel after the lens is installed in a luminaire.
An IES file provides a digital description of the photometric performance of a luminaire or optical system. It records luminous intensity in different directions and allows lighting engineers to reproduce the distribution in software such as DIALux. For a roadway project, this data can be used to evaluate road coverage, pole spacing, uniformity, backlight and potential glare.
This guide explains how to read an IES file, how to interpret its main photometric diagrams and how to use the data when selecting an existing street light lens. It also explains why an IES file should always be evaluated together with the LED package, PCB layout, luminaire structure and actual roadway dimensions.
What Is an IES File?
An IES file is a standardized photometric data file commonly identified by the .ies filename extension. It describes how luminous intensity is distributed around a tested light source or luminaire.
Unlike a product photograph or general datasheet, an IES lighting file contains numerical values measured at multiple horizontal and vertical angles. Lighting software reads these values and reconstructs a three-dimensional model of the light distribution.
An IES file may contain information such as:
- The IES file format or version;
- Manufacturer and luminaire identification;
- Photometric test information;
- Number of lamps or light sources;
- Luminous flux information;
- Photometric coordinate type;
- Horizontal measurement angles;
- Vertical measurement angles;
- Candela values at each measured direction;
- Luminaire dimensions and orientation.
The IES file is different from a lens drawing, LED datasheet or DIALux project file. A lens drawing explains the component's mechanical dimensions. An LED datasheet describes the light source. An IES file represents the measured or calculated photometric output of a defined optical configuration. A DIALux project file combines that photometric data with an installation environment.
Why an IES File Matters for Street Light Lens Selection
Two street lights can use the same number of LEDs, the same power and a similar lens size while producing very different distributions on the road. One may concentrate too much light directly below the pole, while another may extend light farther between poles. One may cover the road width effectively, while another sends too much light behind the luminaire.
The street light photometric distribution determines whether the available light is directed toward the useful area. The IES file helps engineers evaluate:
- How far the light travels along the road;
- How widely it spreads across the road;
- Where maximum luminous intensity occurs;
- How much light is directed behind the pole;
- Whether high-angle intensity may contribute to glare;
- How adjacent luminaires may overlap;
- Whether bright spots and dark zones may appear.
For this reason, an LED street light IES file should be reviewed before a lens is approved for a new luminaire. However, the file must represent the correct LED, PCB and optical assembly. An IES file produced with a different configuration may not accurately predict the performance of the final product.
Asahi offers a range of street and area lighting lenses with different array structures and light distributions. The correct option should be selected using both mechanical compatibility and photometric evaluation.
What Information Is Inside an IES File?
IES Format and Identification Information
The beginning of an IES file normally identifies the format version and may include descriptive information about the manufacturer, luminaire, test laboratory or test report. The amount of information depends on how the file was prepared.
Before using the data, confirm that the product identification matches the luminaire or optical configuration being evaluated. Similar filenames can create confusion when a manufacturer has several lenses, LED packages or power options.
Light Source and Luminous Flux Data
An IES file may include the number of lamps or light sources and the related lumen information. These values help software scale the photometric distribution.
Total lumens are important, but they do not indicate whether the distribution is suitable for a road. A luminaire with high luminous flux can still perform poorly if the optical system sends light outside the useful area or creates excessive brightness near the pole.
When comparing files, determine whether the data represents absolute photometry for the complete luminaire or a relative distribution that depends on additional lumen values. The comparison should use consistent conditions.
Photometric Coordinate Type
Photometric measurements use coordinate systems to describe the direction of luminous intensity. Type C photometry is commonly used for architectural, outdoor and roadway luminaires because it represents light relative to the luminaire's vertical axis.
The coordinate system affects how horizontal and vertical angles should be interpreted. If an IES file is imported with the wrong orientation, the simulated light may point along the road when it should point across the road, or vice versa.
Horizontal and Vertical Angles
Horizontal angles define measurement planes around the luminaire. Vertical angles describe directions from below the luminaire toward the horizontal plane and, where applicable, above it.
Together, these angle sets form a measurement grid. A candela value is assigned to each combination of horizontal and vertical angles. Lighting software uses this grid to reconstruct the complete IES light distribution.
Candela Values
Candela describes luminous intensity in a specific direction. High candela means that more light is concentrated in that direction, but maximum candela alone is not a measure of overall quality.
For a roadside luminaire, the most useful light may need to travel forward, across the road and along its length. A very high intensity directed toward the area immediately below the pole may produce a bright spot without improving coverage between poles.
How to Read the Main Photometric Diagrams
Polar Candela Diagram
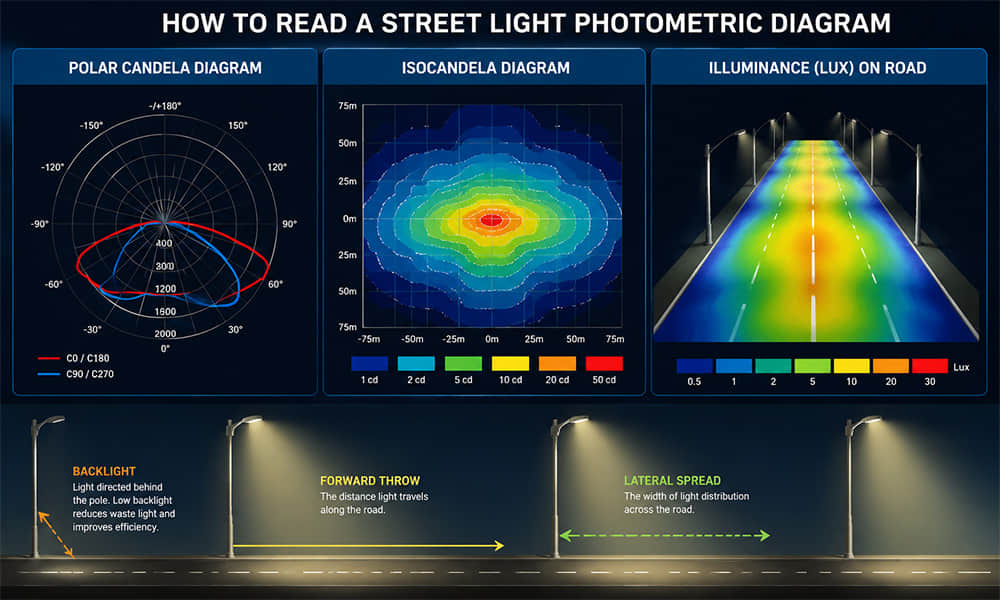
A polar candela diagram converts the numerical intensity values into curves. The distance from the centre of the diagram represents luminous intensity, while the angle represents the direction of the light.
The diagram commonly displays curves for two principal planes, such as C0-C180 and C90-C270. One curve may represent distribution along the road, while the other represents distribution across it. The exact relationship depends on how the luminaire was oriented during testing.
When reading a polar candela diagram, check:
- Whether the two main curves are similar or substantially different;
- At which angle the maximum intensity occurs;
- How quickly intensity decreases away from the peak;
- Whether high intensity appears near horizontal directions;
- Whether the distribution is symmetric or asymmetric.
A symmetric lens normally produces similar distributions in corresponding directions. An asymmetric roadway lens intentionally pushes more light toward the road. Read our article about asymmetric light distribution in LED street lighting for a more detailed explanation.
Isocandela Diagram
An isocandela diagram shows areas of equal luminous intensity. It is especially helpful when evaluating street lighting because it makes the direction and shape of the beam easier to understand.
The diagram can reveal whether light is concentrated in front of the luminaire, extended along the roadway or distributed behind the pole. It can also show whether the distribution has a narrow central peak or a broader pattern.
Use the isocandela diagram to review:
- Forward throw: how far light is directed away from the pole;
- Lateral spread: how effectively the distribution covers the road width;
- Longitudinal reach: how the distribution supports spacing between poles;
- Backlight: how much intensity is directed behind the luminaire;
- Asymmetry: whether the main intensity is intentionally shifted toward the road.
Illuminance or Lux Diagram
A lux diagram is not the same as the raw intensity distribution in an IES file. It represents the calculated illuminance on a surface under defined installation conditions.
Changing the mounting height, luminaire tilt, luminous flux or calculation area will change the lux diagram even when the IES file remains the same. Therefore, a single illuminance image should not be treated as a permanent product characteristic.
Always check the assumptions behind an illuminance diagram before using it to compare LED street light lenses.
Seven Checks for Evaluating a Street Light IES File
1. Confirm the Tested Luminaire Configuration
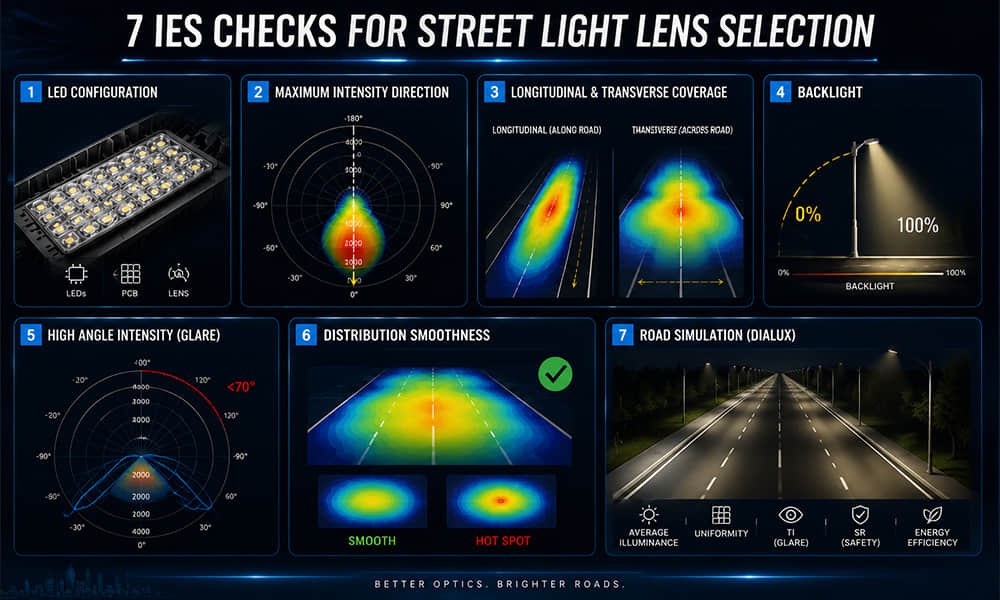
Begin by confirming which LED, PCB and lens were used to create the file. Check the LED model, quantity, operating current, lens model, PCB pitch and luminaire orientation.
If the file was created using a 5050 LED but the new luminaire uses a different package, the result may change. Differences in the light-emitting surface, package height and LED-to-lens distance can affect the distribution.
2. Check the Direction of Maximum Intensity
Identify where the highest candela values occur. For a side-mounted street light, the distribution normally needs to direct useful intensity toward and across the road.
If maximum intensity occurs too close to the vertical axis, the luminaire may create excessive brightness near the pole. If it occurs at an extremely high angle, it may increase glare or send light beyond the intended area.
3. Compare Longitudinal and Transverse Distribution
Roadway lighting requires two different coverage directions. Transverse distribution affects coverage across the road, while longitudinal distribution affects coverage along the road and between poles.
A lens can provide sufficient road width but inadequate longitudinal reach. Another lens may extend well between poles but send too much light beyond the far edge. Both directions must be evaluated.
4. Evaluate Backlight
Backlight is the light distributed behind the luminaire or pole. Some backlight may be useful for sidewalks or pedestrian zones, but excessive backlight wastes energy and may affect nearby properties.
Check whether the IES distribution matches the actual project. A roadway with a sidewalk behind the pole may require a different balance from a road next to residential windows or an environmentally sensitive area.
5. Review High-Angle Intensity and Glare Risk
High-angle light can contribute to visual discomfort and glare. Review intensity near horizontal directions and determine whether the optical distribution sends excessive light toward drivers or outside the target area.
The IES file provides useful directional data, but a complete glare evaluation also requires installation height, observer position, luminaire arrangement and project-level calculations.
6. Look for a Smooth Distribution
A smooth intensity distribution generally makes it easier for adjacent luminaires to overlap without producing abrupt bright and dark areas. Sharp peaks or sudden changes may create concentrated zones when the file is placed into a road simulation.
The objective is not always to make the candela curve completely smooth. Precision optics may intentionally create peaks in specific directions. The important question is whether those peaks support the roadway geometry and target performance.
7. Verify the File in the Actual Road Layout
An IES file cannot determine suitability without an application. Import it into a lighting calculation and use the actual road width, mounting height, pole spacing, boom length, pole arrangement and luminaire tilt.
This final step converts street lighting photometric data into an application result. It is the most reliable way to compare different lenses under consistent project conditions.
How to Identify Type II, Type III or Type IV Distribution
A filename or product model may include T2, T3 or T4, but the photometric data should still be checked. These classifications describe how the luminous intensity is distributed relative to the roadway.
Type II distributions are commonly considered for relatively narrow roads and roadside installations. Type III distributions generally provide wider transverse coverage, while Type IV distributions emphasize forward throw.
Longitudinal categories are also important. In a term such as T2M, the letter “M” generally indicates a medium longitudinal distribution. This affects how the light extends along the road and how adjacent luminaires overlap.
Learn more from our guides to Type I, Type II, Type III, Type IV and Type V distributions and what T2M means in an LED lens.
Classification is useful for initial screening, but two Type II lenses can still produce different longitudinal reach, backlight, cutoff and near-pole intensity. The complete IES data remains necessary.
Why Beam Angle Alone Is Not Enough
Beam angle is useful for describing many symmetric spot, flood and high-bay lenses. It is less effective as a complete description of a complex asymmetric street light distribution.
A road-lighting lens may send light farther along one axis than another. It may also move maximum intensity away from the optical centre or restrict light behind the pole. A single beam-angle value cannot fully describe these characteristics.
Two lenses with a similar nominal beam description may differ in:
- Maximum intensity direction;
- Longitudinal reach;
- Transverse road coverage;
- Near-pole brightness;
- Far-side road coverage;
- Backlight percentage;
- High-angle intensity;
- Cutoff characteristics.
When selecting a roadway lighting lens, use beam angle only as an initial reference. Use the IES file and roadway simulation for the final decision.
How the LED, PCB and Luminaire Change the IES Result
An optical lens does not operate independently. Its distribution is created through the interaction between the LED, lens surface, mechanical position and surrounding luminaire structure.
IES results may change when any of the following changes:
- LED package or manufacturer;
- Size and shape of the light-emitting surface;
- LED package height;
- LED current and luminous flux;
- LED position relative to the lens centre;
- PCB pitch or dimensional tolerance;
- Distance between the PCB and lens;
- Cover glass or protective diffuser;
- Internal luminaire reflection;
- Lens material or surface texture;
- Assembly and injection-moulding tolerance.
A catalogue IES file is valuable for initial evaluation, but final validation should use the intended LED and luminaire configuration. If the PCB or LED is substantially different, new photometric testing may be required.
Asahi's LED optical design capability supports projects that require LED-to-lens matching, ray-tracing analysis, structural evaluation and photometric optimization.
How to Use an IES File in DIALux for Roadway Evaluation
After reviewing the raw data and diagrams, import the file into DIALux or another suitable lighting calculation tool. The purpose is to test the distribution under the intended installation conditions.
- Create the roadway and enter its width, lanes and relevant pedestrian areas.
- Set the luminaire mounting height.
- Enter the distance between poles.
- Select unilateral, staggered, opposite or central arrangement.
- Set the mounting-arm length and luminaire tilt.
- Import the correct IES file.
- Confirm the luminaire orientation relative to the road.
- Set the required calculation surfaces and maintenance factor.
- Run the photometric calculation.
- Review the results and compare alternative lenses.
Depending on the project and applicable standard, the evaluation may include:
- Average illuminance or luminance;
- Minimum illuminance or luminance;
- Overall uniformity;
- Longitudinal uniformity;
- Glare-related values;
- Light on sidewalks or pedestrian areas;
- Light falling outside the target area.
A simulation is only as reliable as its inputs. Incorrect road dimensions, luminaire orientation or maintenance assumptions can produce misleading results. Simulation should also be combined with appropriate photometric testing and project verification.
How to Compare Two IES Files for Lens Selection
To compare two optical options fairly, use the same road geometry, luminous flux, mounting height, pole spacing, luminaire tilt and maintenance factor.
| Comparison Item | Lens A | Lens B |
|---|---|---|
| LED and PCB configuration | Record configuration | Record configuration |
| Longitudinal reach | Evaluate along road | Evaluate along road |
| Transverse coverage | Evaluate road width | Evaluate road width |
| Backlight | Review useful and wasted light | Review useful and wasted light |
| High-angle intensity | Review glare risk | Review glare risk |
| Uniformity | Compare calculated result | Compare calculated result |
| Pole-spacing potential | Test incrementally | Test incrementally |
| Target-road suitability | Record conclusion | Record conclusion |
Do not compare one file at 10,000 lumens with another at 20,000 lumens without normalizing the conditions. Otherwise, the result may reflect lumen differences instead of optical distribution quality.
Common Mistakes When Reading a Street Light IES File
- Looking only at total lumens: high output does not guarantee useful road coverage.
- Looking only at maximum candela: intensity must be directed toward the correct area.
- Relying only on beam angle: asymmetric roadway distributions cannot be fully described by one angle.
- Ignoring luminaire orientation: a rotated file can send the simulated beam in the wrong direction.
- Using the wrong LED configuration: different packages can alter the optical result.
- Ignoring backlight: light behind the pole may be useful, wasted or problematic depending on the site.
- Comparing files under different conditions: road geometry and lumen output must be consistent.
- Checking only average values: minimum values and uniformity are also important.
- Treating a simulation as certification: software results support evaluation but do not independently prove compliance.
When an Existing Street Light Lens Is Suitable
An existing lens is usually the most efficient choice when its optical distribution, LED compatibility, PCB pitch, dimensions and mounting structure match the project.
173 mm 3×8 Integrated Lens Series
The 173 mm 3×8 LED lens series includes integrated 24-LED options for street and area lighting.
Relevant roadway models include T2M and T2M-cutoff distributions. The series can be evaluated for luminaires requiring a larger integrated optical array. The exact model should be matched to the LED package, PCB dimensions and target IES distribution.
50 × 50 mm 2×3 Modular Lens Series
The 50 mm 2×3 street light lens series provides compact six-LED modules.
The series includes a 5050 LED T2M-cutoff option for modular street-light luminaire development. Multiple modules may support different luminaire power levels, but the combined optical assembly must be evaluated as a complete system.
An existing lens may be suitable when:
- The LED package matches the lens design;
- The PCB positions match the lens-cell pitch;
- The lens fits the available luminaire space;
- The mounting and sealing structure is compatible;
- The IES distribution is close to the project requirement;
- The roadway simulation achieves the target performance.
When Custom LED Optics Are Required
A custom LED street light lens may be required when no existing product can provide the necessary mechanical and photometric match.
Typical custom-development conditions include:
- A customer-specific PCB or LED pitch;
- An LED package that is not supported by existing lenses;
- Special road width or pole-spacing requirements;
- Strict backlight or cutoff control;
- A target IES distribution that available products cannot produce;
- Limited optical space inside the luminaire;
- A custom waterproof or mounting structure;
- A high-volume project requiring an independent optical platform.
Asahi provides custom LED lens design and manufacturing, including optical simulation, structure design, optical mould development, samples, photometric evaluation, small-batch trial production and mass production.
What to Send for an Existing Lens Recommendation
To evaluate an existing street light lens efficiently, provide as much of the following information as possible:
- LED manufacturer, model and package;
- LED quantity and operating current;
- PCB layout with LED positions;
- Luminaire 2D or 3D drawing;
- Available lens and mounting space;
- Existing IES file, if available;
- Target IES file or reference distribution;
- Road width and number of lanes;
- Mounting height and pole spacing;
- Pole arrangement and mounting-arm length;
- Luminaire tilt angle;
- Applicable road-lighting standard;
- Required uniformity, glare or backlight targets.
This information allows the optical team to determine whether an existing lens can be used, whether a different PCB arrangement is recommended or whether a custom optic is necessary.
Request an Existing Lens Recommendation
FAQ About IES Files and Street Light Lenses
Q: What does an IES file show?
An IES file contains numerical photometric data describing luminous intensity in different directions. Lighting software uses this data to reproduce the three-dimensional distribution and calculate performance within a road, room or outdoor area.
Q: Does an IES file show the beam angle?
An IES file contains enough directional intensity data to analyze beam spread, but a single beam-angle value may not fully describe an asymmetric street light distribution. Polar candela and isocandela diagrams provide a more complete view.
Q: Can the same lens produce different IES results with different LEDs?
Yes. LED package size, light-emitting surface, package height, position, current and distance from the lens can change the distribution. The PCB, protective cover and luminaire structure may also affect the result.
Q: Can an IES file prove compliance with a road-lighting standard?
An IES file provides the photometric data needed for project calculations, but it does not independently prove compliance. The file must be applied to the actual road geometry, installation conditions and evaluation criteria. Testing and other project documentation may also be required.
Q: Can Asahi provide IES files and evaluate an existing PCB?
Yes. Depending on the product and project stage, Asahi can provide available IES files, datasheets, drawings and optical samples. The optical team can also review the LED, PCB layout, luminaire structure and target distribution to recommend an existing lens or assess custom development.