Optics design software helps engineers predict how light travels through a lens, where it reaches the target, and which parts of an assembly create unwanted light. For LED lighting projects, its practical value is not simply producing an attractive beam image. It is providing a model that supports design decisions and helps explain differences between simulation and physical samples.
An optical design program may be used to build the LED source model, adjust optical surfaces, evaluate mechanical interference, and generate photometric reports. These tasks are connected, but they are not interchangeable: designing a secondary optic is different from calculating how a finished luminaire illuminates a room or road.
This guide explains how to organize an LED lens simulation workflow, evaluate software against actual project tasks, and read the resulting reports. It also shows how to investigate a common development problem: a measured beam that is wider than the simulated result. For an overview of Asahi’s LED lenses, visit our main product and company introduction.
Where Optics Design Software Fits in an LED Lens Project
Before comparing software, identify the decision your team needs to make. A mechanical clearance question, an optical surface optimization task, and an installation-level illuminance calculation require different capabilities.
| Project Task | Typical Tool Category | Required Output |
|---|---|---|
| Develop or modify an LED secondary optic | Non-sequential optical modelling and ray tracing, such as LightTools, TracePro, or an appropriately configured OpticStudio workflow | Optical geometry, intensity distribution, target-plane results, flux accounting, and sensitivity analysis |
| Integrate the lens with a PCB, holder, gasket, and housing | Mechanical CAD, such as SolidWorks, combined with optical-model exchange | Assembly geometry, locating features, clearances, and dimensional references |
| Evaluate finished luminaires in an installation | Lighting calculation software, such as DIALux | Project-level lighting calculations using luminaire photometry and installation geometry |
LightTools and TracePro Have Overlapping Capabilities
LightTools and TracePro both support illumination analysis, and their capabilities overlap. It would be misleading to describe one as an optimization tool and the other only as a stray-light tool.
The official LightTools overview describes modelling, ray tracing, optimization, and analysis capabilities. The relevant question is whether the selected configuration supports your source data, optical geometry, analysis requirements, and working methods.
A team already using OpticStudio should first identify a specific workflow gap. That gap might involve source-file handling, illumination optimization, CAD exchange, or reporting. An existing tool should not be replaced simply because another program is more frequently mentioned in LED lighting articles.
What to Test Before Choosing an Optical Design Program
A useful software trial reproduces a small but representative part of your actual workflow. A demonstration model supplied by a vendor may show what the software can do without revealing how much work your own project will require.
Use the following tasks to evaluate an optical design program for LED lens simulation:
- Import the intended LED source. Confirm that the program can use the available manufacturer data, including relevant ray files. Check the source position, orientation, dimensions, spectrum, and flux normalization after import.
- Change a relevant design parameter. Adjust an optical surface or the LED-to-lens position. Check whether the model updates reliably and whether the revised geometry can be transferred to the mechanical workflow.
- Build a meaningful optimization objective. Test whether the software can work toward the required distribution or target-plane result while respecting dimensional constraints. Maximizing peak intensity alone is not a substitute for meeting a lighting requirement.
- Investigate unwanted ray paths. Identify which surfaces contribute to spill light, reflections, or unwanted secondary features. A useful analysis should help locate the cause, not merely display the final pattern.
- Complete the report and handover. Export the required numerical data, plots, geometry, and available photometric formats. Check that another engineer can identify the model version and reproduce the reported conditions.
The official TracePro information also describes illumination, optimization, and stray-light analysis capabilities. Use vendor documentation to establish a feature shortlist, then use the trial to test how those features work with your files and project constraints.
Record the software edition, enabled modules, setup effort, hardware, calculation time, and repeatability of the outputs. These observations provide a more useful purchasing basis than a general claim that one program is universally more accurate or easier to use.
A Practical LED Lens Simulation Workflow
1. Define the Target and Mechanical Constraints
Start with the required lighting result rather than a preferred lens shape. Define the target area, mounting position, aiming direction, working distance, and applicable performance criteria. Include restrictions on light outside the intended area.
For a target-plane requirement, specify the calculation boundary and how illuminance and uniformity will be assessed. For an angular distribution requirement, specify the relevant planes, directions, and intensity limits.
A rectangular target does not automatically require an asymmetric distribution. A luminaire aimed normally at the centre of a rectangle may use a distribution with different horizontal and vertical spreads while remaining symmetric about both axes. Offset mounting or oblique projection may instead require unequal light allocation toward different parts of the target.
Likewise, freeform optical design describes an approach to defining optical surfaces; it does not automatically mean the resulting beam is asymmetric.
Mechanical inputs should include the available optical envelope, LED position, mounting references, protective cover, and any features that could block light or restrict the lens geometry.
2. Build the Source Model Around the Actual LED
A package designation such as 3030, 3535, or 5050 is not a complete optical description. LEDs with similar external dimensions can have different emitting areas, chip arrangements, package optics, and angular emission characteristics.
For secondary-optic development, the source model should represent the spatial and directional emission relevant to the lens. Manufacturer ray data can be valuable because the optic operates close to an extended light source, not an ideal mathematical point.
A far-field IES distribution alone does not uniquely reconstruct the source’s near-field spatial and directional emission. Using it as the only description of an LED placed inside a secondary optic can therefore leave important information undefined.
Document the LED part number, source-file version, operating condition represented by the data, flux basis, and coordinate system. This creates a clear reference for later comparisons.
3. Include the Components That Can Change the Distribution
The lens is only one part of the model. Holders, nearby PCB surfaces, windows, reflectors, gaskets, and housing edges can intercept or redirect light.
Assign optical properties deliberately. A CAD body imported as a perfectly absorbing surface will behave differently from a reflective holder. A clear cover modelled without its actual surface structure may fail to reproduce the measured distribution.
The assembly must also use consistent dimensional references. The distance from a PCB surface to a lens support feature is not necessarily the distance from the LED emitting surface to the optical entrance surface. Our guide to matching an LED lens to a PCB layout explains these alignment and interface considerations in more detail.
4. Establish a Baseline and Define Comparison Metrics
Save a baseline model before optimization. Record the source, materials, geometry, detector settings, and calculation configuration so that later changes can be attributed to a known design revision.
Choose metrics that reflect the project objective. These may include peak intensity, intensity in specified directions, useful flux reaching the target, minimum illuminance, uniformity, or light entering a restricted region.
State how alternatives are normalized. Comparing designs with the same source flux allows optical throughput differences to remain visible. Renormalizing each design to the same emitted lumens can help compare distribution shape, but it removes those throughput differences from the comparison.
Both approaches can be useful. They answer different questions and should not be mixed without explanation.
5. Evaluate Assembly and Manufacturing Variation
A design that meets its target only at one exact alignment may be difficult to reproduce. Evaluate relevant changes in LED position, lens height, tilt, and other dimensions connected to the assembly.
Use drawing tolerances and measured process information to select meaningful variations. Arbitrary displacement values may reveal sensitivity, but they do not establish whether the production process is capable.
A set of individual parameter sweeps is also not the same as a statistical yield study. Estimating production yield requires appropriate distributions, relationships between variables, and acceptance criteria.
LED Optical Simulation Report Checklist
A useful report should allow the reader to identify what was modelled, what was calculated, and which decision the results support.
| Report Item | What Should Be Identified | What It Helps You Decide |
|---|---|---|
| Source and configuration | LED part number, source data, flux basis, assembly revision, materials, and coordinate system | Whether the model represents the intended assembly |
| Intensity distribution | Units, normalization, relevant C-planes, peak direction, and beam-width definition | Whether the angular distribution meets the specification |
| Target-plane results | Distance, orientation, calculation boundary, grid, units, and uniformity definition | Whether the specified area receives the required illumination |
| Flux accounting | Input flux, output flux, useful target flux, and the denominator used for each ratio | Where light is transmitted, lost, or directed outside the useful area |
| Variation analysis | Changed dimensions, ranges, baseline conditions, and acceptance limits | Which tolerances need closer control |
| Numerical stability | Ray count, detector resolution, relevant calculation settings, and convergence checks | Whether a reported change is larger than calculation noise |
Read False-Color Images with Their Units and Scales
A false-color image is a visualization of calculated values, not an independent performance metric. Before comparing two images, check the quantity displayed, units, spatial scale, detector orientation, and color limits.
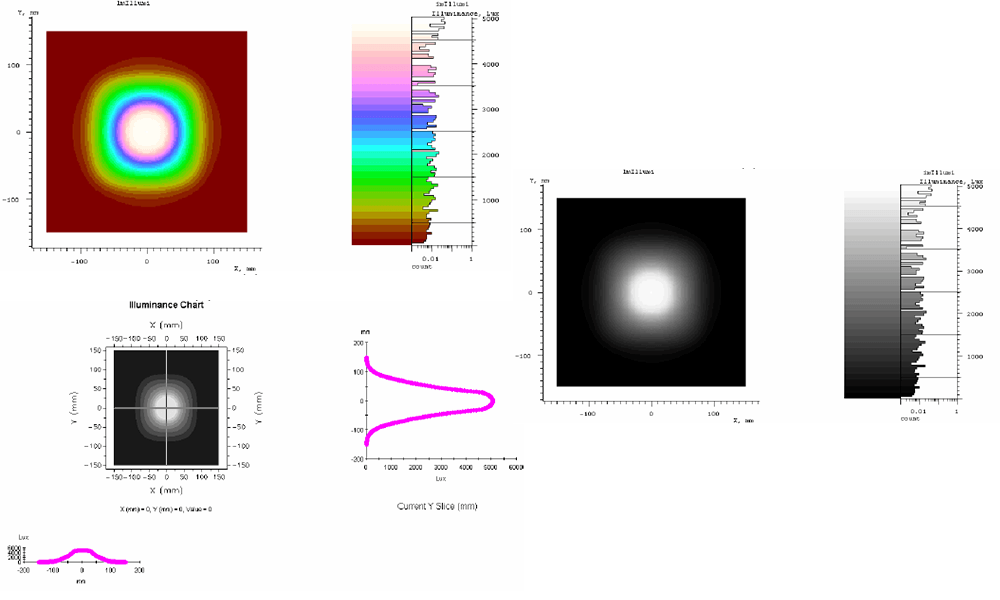
Automatic color scaling can make two distributions look similarly intense even when their absolute values differ substantially. Conversely, a change in the color palette can make a minor numerical difference appear dramatic.
For a direct comparison, use matching display limits and calculation conditions. Read the numerical grid or exported data alongside the image. Cross-sectional profiles can help reveal an off-centre peak, unequal spread, or a shoulder that is difficult to judge from colors alone.
Separate Beam Shape from Useful Illumination
Beam angle is commonly reported at 50% of peak intensity, but the supplier’s definition should be checked. An FWHM beam width does not mark the boundary of all emitted light or define the area meeting a project’s illuminance requirement.
Similarly, peak candela describes intensity in a particular direction. Peak cd/lm helps compare concentration relative to the stated luminous-flux basis. Neither value establishes target-plane uniformity.
Use angular data to assess distribution and target-plane calculations to assess the specified working area. A design can perform well in one comparison and still fail the other requirement.
When the Simulated Beam Is Narrower Than the Measured Beam
Do not immediately redesign the optical surface. First determine whether the difference comes from the comparison method, source representation, assembly, or an omitted component.
Step 1: Confirm That You Are Comparing the Same Quantity
Check whether both results describe angular luminous intensity or target-plane illuminance. Confirm the same measurement plane, optical axis, normalization, and width definition.
A photograph of a light spot is not an FWHM measurement. Exposure, camera processing, surface reflectance, and image clipping can change its apparent size. Even a measured target-plane illuminance profile is not directly interchangeable with an angular intensity curve.
Resolve these differences before treating the wider appearance as evidence of an optical-model error.
Step 2: Check the LED Source Representation
Verify the exact LED used in the sample. A model based on an ideal point source or a smaller emitting area can predict a narrower distribution than the real extended source produces.
Compare emitting-area dimensions, package optics, source orientation, and the manufacturer data used in the model. If the physical sample uses a different LED version, update the source before adjusting the lens.
Step 3: Measure the Assembled Position
Check the actual LED-to-lens relationship, including lateral displacement, height, and tilt. Measure from the same reference surfaces used in the model.
Sweep the measured deviations in the simulation and compare their effects with the observed beam. Do not assume that increasing the gap always widens the beam or always reduces peak intensity; the response depends on the optical geometry and source position.
Step 4: Isolate Covers and Nearby Components
Where the sample construction permits safe comparison, test with and without the protective cover or other suspected components under otherwise unchanged conditions.
A textured window, unmodelled diffuser, reflective holder, or housing edge can introduce distribution features absent from the lens-only model. Component-by-component comparisons help identify which interface requires a better optical description.
Step 5: Check Repeatability Before Revising the Design
Compare multiple assemblies to distinguish a systematic difference from a sample-specific issue. Inspect lens identity, seating, surface condition, and relevant dimensions.
If the difference remains consistent after the source and assembly are matched, review material properties, surface descriptions, imported geometry, and numerical settings. This sequence helps avoid changing a sound lens design to compensate for an incorrect source or assembly assumption.
Using the Distribution in DIALux: Check Data and Authorization
DIALux is used to evaluate lighting installations from luminaire photometric data. It does not replace the optical surface development workflow described above.
Check licensing before building a process around imported data. According to the DIALux information on non-member luminaires, free planning and calculation are available for luminaires from DIALux Members; using non-member luminaires requires the relevant entitlement, such as Unlock Non-Members or DIALux Pro. Confirm the current conditions for your intended workflow.
Also identify whether an imported IES file represents a simulation or a measurement. A simulated distribution can support development, while measured photometry describes the tested sample under its recorded conditions.
Check the orientation, units, flux scaling, and luminaire configuration before using either file in a layout. Our guide to reading an IES file for LED lens selection explains the photometric information that should be reviewed.
Connect Simulation Approval to Physical Sample Testing
Simulation approval should define what will be checked on the sample. Use the agreed source, assembly references, operating conditions, and acceptance metrics to create a comparable test setup.
A sample review might compare the main intensity planes, peak direction, total luminous flux, beam-width definition, and the relevant target-plane results. Select the measurements needed for the application rather than producing every available plot.
For a more detailed measurement workflow, see our guide to testing LED lens optical performance before production.
Keep the tested assembly and model revisions connected to the drawings used for tooling and production. Our overview of the custom LED lens manufacturing process explains how optical development connects with subsequent manufacturing stages.
Request a Preliminary Optical Review from Asahi
If you are evaluating an existing optic or preparing a new lens project, start with the LED part number, required target area or angular distribution, mounting geometry, and available optical space. Include illuminance, uniformity, or restricted-light requirements where they have been defined.
PCB drawings, assembly CAD, existing IES/LDT data, and measurement reports can provide further detail. You do not need to select a software package or produce a complete optical model before contacting us.
A preliminary review is intended to identify:
- Existing-lens starting options: whether an existing optic appears relevant and which compatibility checks remain necessary.
- Information gaps: whether the supplied data is sufficient for a preliminary feasibility judgment and what is still missing.
- Key constraints: optical or mechanical obstacles visible from the available information.
- The next verification step: the additional drawing, sample comparison, measurement, or simulation needed to move the project forward.
If an existing optic cannot address the requirement, the findings can form the starting brief for Asahi’s LED optical design service. This keeps the next stage focused on a defined lighting problem and a clear set of evaluation criteria.