Full spectrum LED grow lights should be evaluated by both their spectral output and the light delivered across the plant canopy. A broad spectrum does not, by itself, prove that a fixture provides enough light at the edges of a growing bed or distributes it evenly between plants.
For luminaire manufacturers, OEM engineers and commercial cultivation teams, the practical question is not simply whether a light is labelled full spectrum. It is whether the documented spectrum, fixture output and canopy-level measurements match the intended crop and installation. Start with the spectrum, then check photon output, the PPFD map and daily light exposure.
What Are Full Spectrum LED Grow Lights?
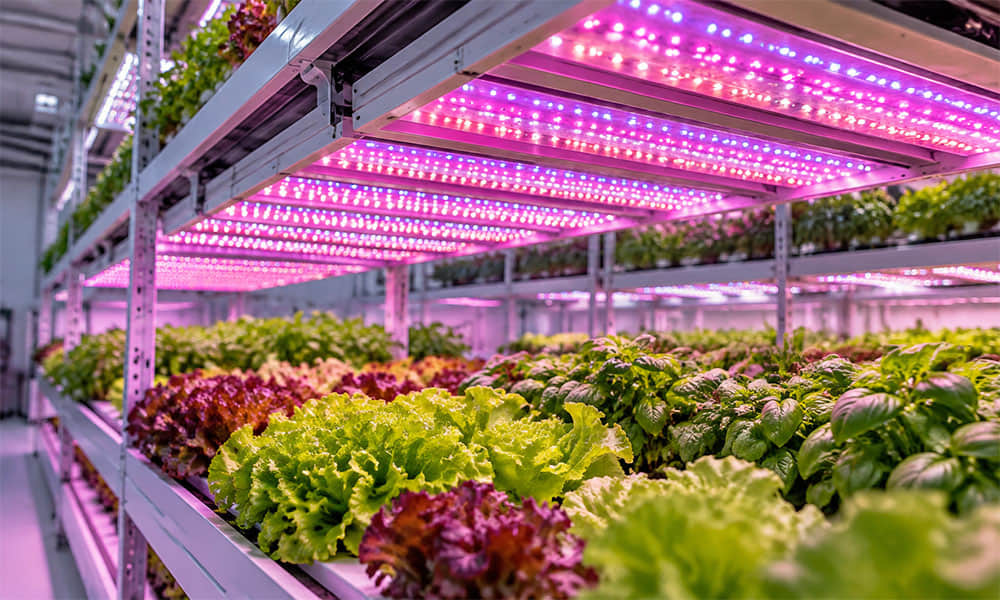
Full spectrum LED grow lights generally use broad-spectrum output, often produced by white LEDs with or without additional narrow-band LEDs. The label does not specify one fixed spectral recipe, guarantee a match to sunlight or confirm the presence of ultraviolet or far-red output.
Ask for a spectral power distribution (SPD) graph for the actual fixture and operating setting. Check the wavelength range, relative peaks and any separately controlled channels. A normalized graph shows the shape of the spectrum, not the total amount of light emitted.
Color temperature and a white appearance are not substitutes for this information. Two lights can look similar to people while having different spectral distributions. For a tunable fixture, a spectrum measured with every channel at maximum output may not represent the setting used during cultivation.
Are Full Spectrum Grow Lights Better Than Red-and-Blue Lights?
Neither description establishes a universal winner. Compare the spectrum with the crop, growth stage, available daylight and production objective. A broader spectrum is not automatically a better crop recipe, and a red-and-blue fixture is not automatically unsuitable.
For example, a greenhouse installation supplements an existing daylight spectrum, while an enclosed growing room may rely entirely on electric lighting. Those are different starting conditions, even when the same crop is grown.
Which Specifications Matter Beyond the Spectrum Label?
Separate what the fixture emits from what reaches the plants. These measurements answer different questions:
| Measurement | Meaning | Selection question |
|---|---|---|
| SPD | Optical power distributed by wavelength. | Does the documented spectrum match the required operating recipe? |
| PPF, µmol/s | Photosynthetic photon output per second. | How much output does the complete fixture provide? |
| PPE, µmol/J | PPF divided by electrical input power. | How efficiently does the fixture convert electricity into this output? |
| PPFD, µmol/m²/s | Photosynthetic photon flux received per unit area. | How much reaches each measured location on the canopy plane? |
Traditional PPF and PPFD use the 400–700 nm range. If a supplier reports an extended wavelength range, compare like-for-like values rather than treating the numbers as interchangeable. Far-red output can be relevant to a crop recipe without being included in traditional PPF.
Also check the measurement level. An LED package's efficacy is not the efficacy of a finished luminaire, which includes the driver and optical components. Wattage alone cannot tell you the fixture's photon output.
For installation-specific requirements such as growing-bed dimensions, LED-bar spacing and available clearance, our horticulture lighting optics application page connects those inputs to optical selection. Here, the next step is to examine whether the supplier's distribution data represents that installation.
How Do You Read a PPFD Map Before Comparing Grow Lights?
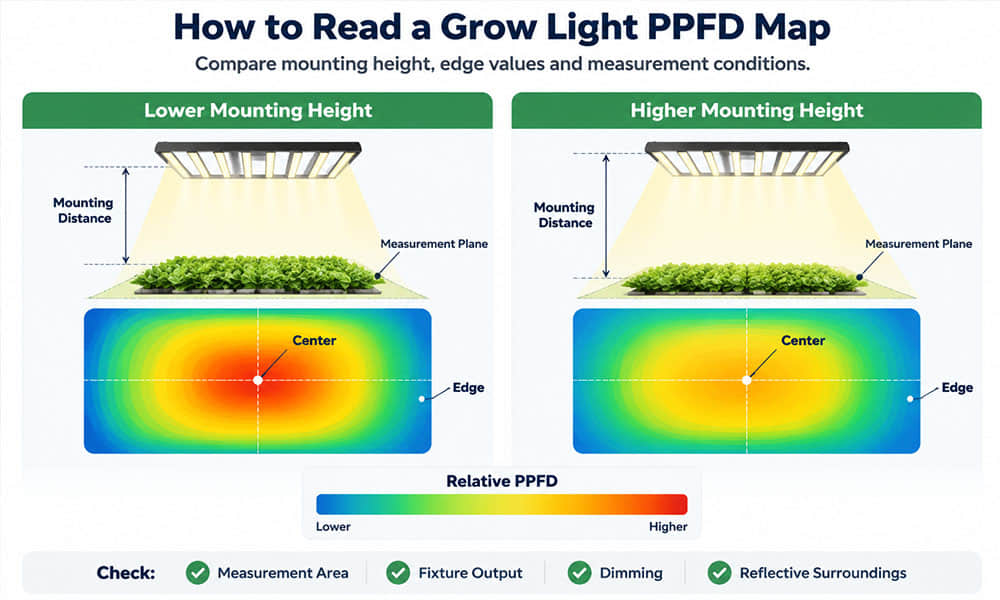
Compare maps only after matching their measurement conditions. A higher central reading may reflect a shorter measurement distance, while a smaller reported area can hide weak edges or raise the reported average. Neither establishes that a fixture better matches your full growing bed.
Check the Setup Behind the Map
Look for the following information alongside the plotted values:
- Canopy distance: the distance from the stated fixture reference point to the measurement plane.
- Area and grid: the full measured dimensions, sampling interval and locations of edge readings.
- Fixture arrangement: the number of luminaires, bar positions, spacing and orientation.
- Operating condition: actual input power, dimming level, channel settings and stabilized operating state.
- Surroundings: reflective walls, tent surfaces, adjacent fixtures and other light sources.
- Data method: measured or simulated results, the wavelength range and the instrument or calculation method used.
A map from a reflective enclosure should not be treated as an open-bench result. Similarly, a tightly cropped map may omit weak corners that fall inside your intended cultivation area. Request comparable conditions before ranking fixtures by their published numbers.
Read the Whole Growing Area, Not Just the Peak
Inspect the average, minimum and maximum PPFD together. Check the bed edges and spaces between light bars, not only the point directly beneath the fixture. Use numerical values as well as colors: two heat maps can look equally uniform while using different color scales.
If uniformity is reported as minimum divided by average PPFD, the calculation is:
U0 = minimum PPFD ÷ average PPFD
Confirm that both values refer to the same area and grid. A sparse grid can miss a local low point. A good ratio also does not prove sufficient intensity: a uniformly dim area can still fall below the crop's specified requirement.
For acceptance, compare the mapped results with the agreed target and uniformity criteria across the actual growing area. Do not interpret a nominal beam angle as the boundary of adequate plant illumination.
The DLC's horticultural lighting FAQ explains an important data-format limitation: ordinary IES files and their common software workflows assume human-vision quantities such as candelas and lumens. They are not automatically photon-distribution data. A lux map cannot simply be relabelled as a PPFD map without a valid spectral conversion method.
How Does Lighting Duration Change the Daily Light Dose?
Daily light integral, or DLI, measures the accumulated photosynthetic photon exposure per unit area over a day. For constant PPFD during a fixed lighting period:
DLI (mol/m²/day) = PPFD (µmol/m²/s) × lighting hours × 0.0036
For a calculation example, assume one measurement location receives a constant 300 µmol/m²/s for 14 hours, with no contribution from daylight or other sources:
300 × 14 × 0.0036 = 15.12 mol/m²/day
This is the daily dose at that location, not a universal crop recommendation or proof that the canopy edges receive the same amount. Greenhouse daylight and changing dimming schedules require accumulation over time. Crop-specific photoperiod requirements also remain relevant.
Luminus explains the relationship between PPF, PPFD and DLI, distinguishing source output, light received at a surface and daily exposure.
What Can Optical Lenses Improve—and What Can’t They Fix?
Secondary optics redistribute the light produced by the LED system. They can change where photons arrive and how neighboring beams overlap, but an ordinary lens cannot generate a missing spectral band or create additional source output.
Correcting Distribution Rather Than Changing the Spectrum
If the selected spectrum is appropriate but the PPFD map shows a strong center and weak edges, investigate distribution before changing the spectral recipe. Possible adjustments include the optical pattern, bar spacing, edge-bar position and canopy distance.
A wider distribution may help adjacent beams overlap at a short distance, but it may also send more light beyond a narrow growing bed. A more concentrated pattern may suit another geometry. Evaluate the trade-off over the defined cultivation area rather than choosing the widest or narrowest available optic.
If the entire area receives insufficient light, first check total fixture output, dimming and installation losses. Redistributing a limited output cannot raise every location indefinitely.
Checking Spectral Mixing and Transmission
When white, red and other LEDs occupy different positions on a PCB, their distributions may not overlap equally at close range. A relatively even total PPFD map can therefore hide differences in spectral proportions across the canopy.
For a suspected mixing problem, compare spectral measurements at representative center and edge positions under the intended channel settings. Review LED placement and optical mixing features together. A single integrated spectrum does not describe every location beneath the fixture.
Lens and cover transmission also vary with wavelength. A visible-light transmission figure alone does not establish performance in UV or far-red bands. Check the relevant material data and complete optical assembly when those bands are part of the design.
An Existing Array to Evaluate for Wide-Distribution Fixtures
For a high-density LED layout requiring a wide distribution, Asahi's multi-lens module collection includes the AJHB320D120LED110G horticultural model. Its published catalog parameters are:
- Array: 120-in-1.
- Nominal beam angle: 110°.
- Dimensions: 320.87 × 79.83 mm.
- Listed LED packages: 2835 / 3030.
These parameters identify a candidate for evaluation, not a guaranteed canopy result. Package size alone does not confirm compatibility with every LED model or PCB pitch; the board layout and mechanical drawing must also match.
What Information Is Needed for a Grow Light Optics Review?
To assess an optical option for full spectrum LED grow lights, start with four groups of information:
- Source: LED model, spectrum information and intended channel settings.
- Layout: PCB drawing or LED positions, bar dimensions and available optical space.
- Installation: growing-area dimensions, canopy distance and fixture spacing.
- Target: required PPFD and uniformity, plus an existing map if available.
Asahi Optics can use these inputs to assess candidate existing lenses, identify LED or mounting compatibility obstacles, and clarify which additional measurements or simulations are needed. This optical review supports fixture development; it does not replace crop-specific spectrum and cultivation decisions.
Send your grow light layout and canopy requirements to Asahi Optics to review an existing optical option before considering a new lens design.